“Military expenditure” covers all expenditure on: the armed forces, including peacekeeping forces; defense ministries and other government agencies involved in defense projects; paramilitary forces that are trained, equipped and available for military operations; and military space activities.
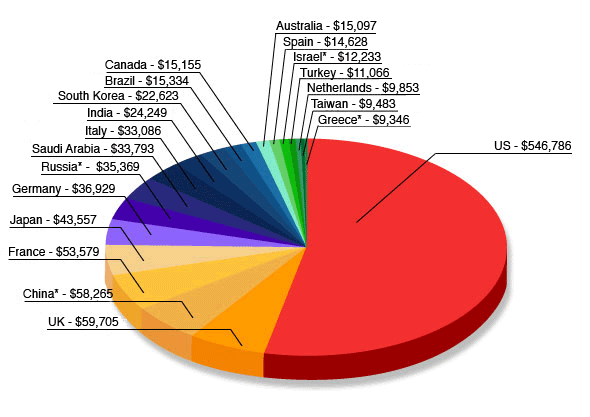
The top 20 countries ranked by global military expenditure in 2007, in millions of constant 2005 US dollars

In 2006 Chinese military spending surpassed that of Japan for the first time, while as late as 1999, Chinese military spending was only half of that of Japan. (Source: www.sipri.org)
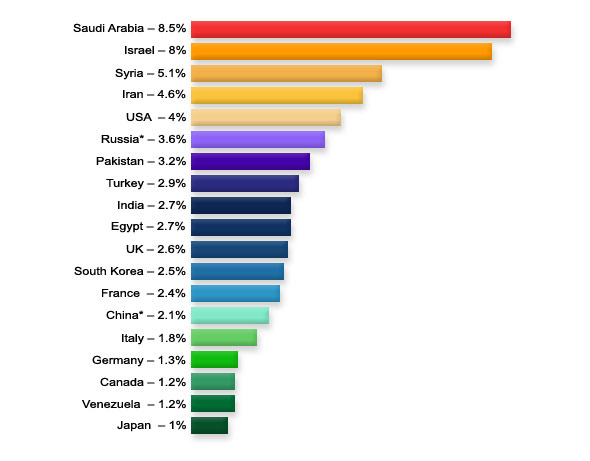
Global military expenditures for select countries in 2006, as percentage of gross domestic product (GDP)

While the U.S. spends 4% of its GDP on its military, Japan’s spending has only recently surpassed 1% of its GDP.
Here is the rest of the world, ranked by military expenditure in millions of USD in 2006.
| COUNTRY | Military expenditure as percentage of GDP | Military expenditure in millions of constant 2005 US dollars |
| Iran | 4.6 | 7,677 |
| Syria | 5.1 | 7,328 |
| Poland | 2 | 6,506 |
| Singapore | 4.7 | 5,862 |
| Sweden | 1.5 | 5,435 |
| Colombia | 4 | 5,240 |
| North Korea | na | 5,217** |
| Chile | 3.6 | 4,851 |
| Norway | 1.5 | 4,826 |
| Pakistan | 3.2 | 4,465 |
| Belgium | 1.1 | 4,197 |
| South Africa | 1.5 | 3,978 |
| Kuwait | 4 * | 3,909 * |
| Oman | 11.2 | 3,905 |
| Indonesia | 1.3 * | 3,802 * |
| Denmark | 1.4 | 3,792 |
| Portugal | 1.9 * | 3,660 * |
| Mexico | 0.4 | 3,262 |
| Switzerland | 0.8 | 3,157 |
| Malaysia | 2.2 | 3,054 |
| Algeria | 2.7 | 2,992 |
| Finland | 1.4 | 2,793 |
| Iraq | 7.8 * | 2,783 * |
| Ukraine | 2.8 | 2,699 |
| Egypt | 2.7 | 2,674 |
| Austria | 0.8 | 2,580 |
| Czech Republic | 1.7 | 2,253 |
| Thailand | 1.1 * | 2,060 * |
| Morocco | 3.7 | 2,049 |
| Romania | 1.8 | 2,036 |
| Venezuela | 1.2 | 1,884 |
| Argentina | 0.9 | 1,776 |
| Hungary | 1.2 | 1,340 |
| Peru | 1.3 | 1,193 |
| New Zealand | 1.1 | 1,177 |
| Ireland | 0.5 | 1,135 |
| Lebanon | 4.6 * | 999 * |
| Ecuador | 2.3 | 922 |
| Philippines | 0.9 | 880 |
| Slovakia | 1.7 | 835 |
| Croatia | 1.9 | 793 |
| Yemen, Arab Republic | 4.3 | 715 |
| Sri Lanka | 2.9 | 713 |
| Nigeria | 0.6 | 703 |
| Kazakhstan | 1 | 693 |
| Bangladesh | 1 | 684 |
| Bulgaria | 2.3 | 663 |
| Jordan | 5 | 660 |
| Azerbaijan | 3.6 | 625 |
| Slovenia | 1.6 | 589 |
| Belarus | 1.7 | 588 |
| Libya | 1.1 | 568 |
| Bahrain | 3.5 | 528 |
| Tunisia | 1.4 | 423 |
| Georgia | 5.2 | 362 |
| Latvia | 1.8 | 342 |
| Lithuania | 1.2 | 338 |
| Luxembourg | 0.8 * | 319 * |
| Kenya | 1.6 | 313 |
| Botswana | 2.7 | 290 |
| Ethiopia | 2.1 | 263 |
| Brunei Darussalam | 3.5 * | 260 * |
| Côte d’Ivoire | 1.5 | 259 |
| Estonia | 1.6 | 251 |
| Cameroon | 1.4 | 242 |
| Cyprus | 1.4 | 239 |
| Uruguay | 1.3 | 219 |
| Namibia | 3.1 | 202 |
| Uganda | 2 | 196 |
| Dominican Republic | 0.5 | 194 |
| Bosnia and Herzegovina | 1.7 | 165 |
| Armenia | 2.8 | 157 |
| Bolivia | 1.4 | 149 |
| Tanzania | 1.1 | 149 |
| Senegal | 1.6 | 144 |
| Nepal | 1.7 * | 143 * |
| Congo, Democratic Republic of the | 1.9 * | 142 * |
| Guatemala | 0.4 | 137 |
| Albania | 1.6 | 135 |
| Zambia | 1.7 | 135 |
| Mali | 2.2 | 129 |
| Macedonia | 2 | 121 |
| Afghanistan | 1.5 | 119 |
| El Salvador | 0.6 | 110 |
| Zimbabwe | 1.9 * | 107 * |
| Gabon | 1.1 | 106 |
| Kyrgyzstan | 3.2 | 83.3 |
| Congo, Republic of | 1.2 | 80.8 |
| Mauritania | 3 | 77.3 |
| Cambodia | 1.1 | 76.5 |
| Jamaica | 0.7 | 70.6 |
| Ghana | 0.6 | 69 |
| Burkina Faso | 1.2 | 68.7 |
| Paraguay | 0.8 | 63.7 |
| Mozambique | 0.8 | 55.9 |
| Chad | 0.9 | 54.2 |
| Honduras | 0.6 | 52.4 |
| Madagascar | 1 | 52.1 |
| Rwanda | 1.9 | 49.7 |
| Bahamas | 0.8 | 47.1 |
| Benin | 1 * | 46.8 * |
| Fiji | 1.4 | 42.7 |
| Malta | 0.7 | 42.6 |
| Burundi | 4.7 | 41.4 |
| Malawi | 1.7 * | 38.9 * |
| Mongolia | 1.5 | 36.5 |
| Lesotho | 2.4 | 35.4 |
| Nicaragua | 0.7 | 33.4 |
| Papua New Guinea | 0.5 | 29.4 |
| Sierra Leone | 2.1 * | 26.4 * |
| Barbados | 0.8 * | 24.6 * |
| Seychelles | 1.9 | 14.6 |
| Mauritius | 0.2 | 10.7 |
| Cape Verde | 0.6 | 6.7 |
| Liberia | 0.8 * | 4.6 * |
| Tonga | 1.4 | 3.3 |
| Iceland | 0 | 0 |
| Angola | 3.7 * | na |
| Costa Rica | 0 | na |
| 2006 data for Belize, Central African Republic, Cuba, Czechoslovakia, Djibouti, Equatorial Guinea, Eritrea, Gambia, Guinea, Guinea-Bissau, Guyana, Haiti, Laos, Myanmar (Burma), Niger, Panama, Qatar, Somalia, Sudan, Swaziland, Tajikistan, Togo, Trinidad and Tobago, Turkmenistan, United Arab Emirates, Uzbekistan, Vietnam, and Yugoslavia is unavailable. | ||
| * denotes estimated totals ** from CIA World Factbook, 2005 All other information from the Stockholm International Peace Research Institute (SIPRI) (http://milexdata.sipri.org/) |
||
| back to top | ||
